Using Math Models: Can You See All the Sets?

Seeing sets
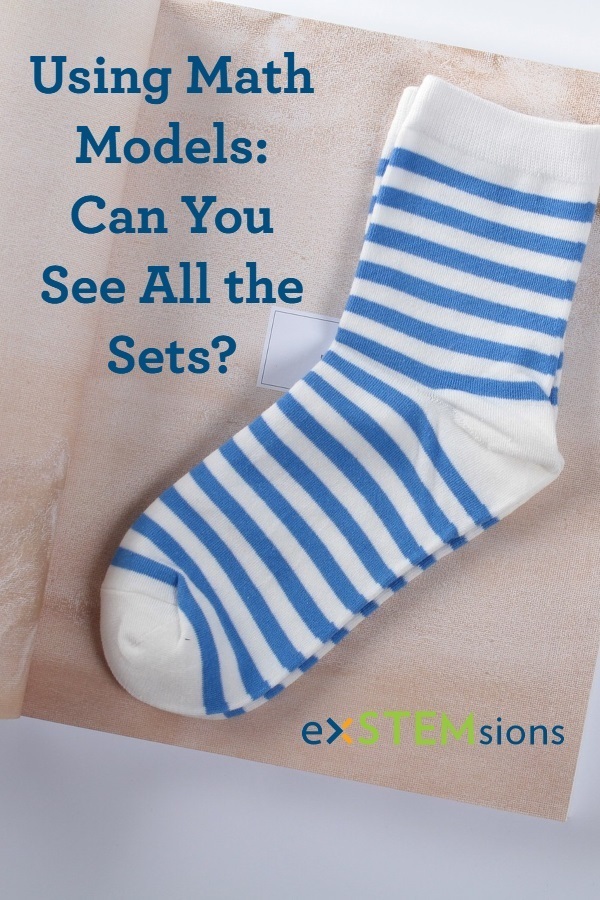
We often need to talk about sets when doing mathematics. Sets can be thought of very simply as boxes to put your mathematical stuff in. And since we often use visualization as one of our handy problem-solving tools, it makes sense to visualize sets. You might think that the most natural way to draw a set is to just represent it with a very symmetric shape, like a circle, and we agree with you. When you represent sets with circles, you are drawing something known as a Venn diagram. Here is a diagram representing two silly sets: one set containing all the blue socks that you own, and another containing all the cotton socks that you own.
More possibilities
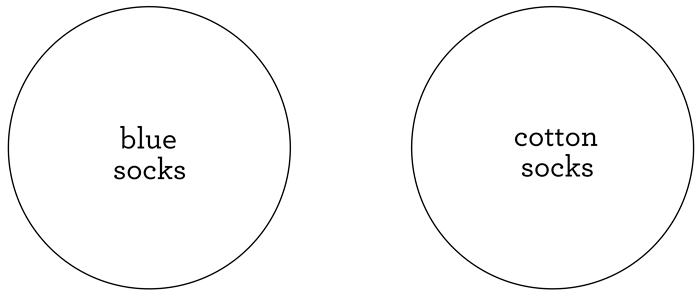
Of course, you might own a few socks that are both blue and cotton. In that case, we should make the circles overlap to allow for that possibility. Then, any socks that are in that overlap are in both circles, and so in both sets. After we shift our circles a bit, we have a new diagram, where we’ve labeled the different regions to show which socks belong in each. All the socks that are both blue and cotton are in our new overlap. Socks in the blue sock set that aren’t in that middle region are just blue, and not cotton. Socks in the cotton sock set that aren’t in that middle region are cotton, but not blue.
All the possibilities for two sets
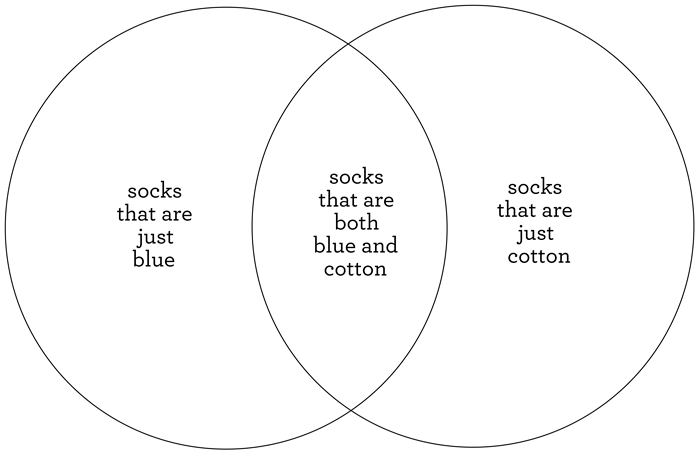
But you probably own other types of socks, right? Polyester ones, red ones? If you’re thinking about sets of socks, these socks are all part of a larger set: the set of ALL your socks! The set that contains everything that we care about in a problem is called the universal set, typically represented with a rectangle. Here, our universal set is evidently the set of all the socks that you own (and feel free to think of that rectangle as a dresser drawer full of all your socks!). Notice that if we’re thinking about these sets as boxes (and we are), then some of your socks could fall outside of those circles, but still inside that rectangular drawer; those socks would still of course be socks that you own, but they wouldn’t be blue or cotton.
All the possibilities for three sets
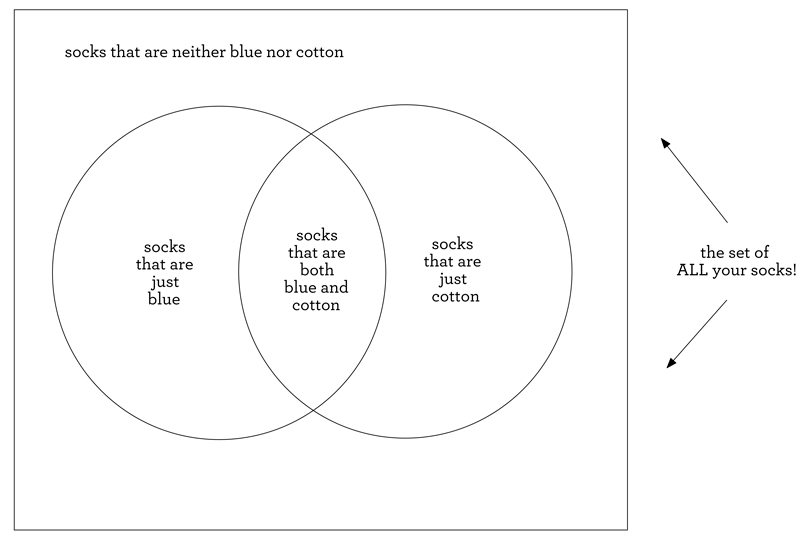
And so, we’ve arrived at the most general possible Venn diagram for two sets. In other words, the above diagram shows you ALL possible options for your socks, as far as being blue and/or cotton is concerned. Notice that there are 4 such options, and in our diagram, there is a region that represents each option. The same kind of thinking allows us to draw the most general possible Venn diagram for three sets, call them A, B, and C. Let’s keep using equal circles to represent our sets, for the simple reason that it looks nice!
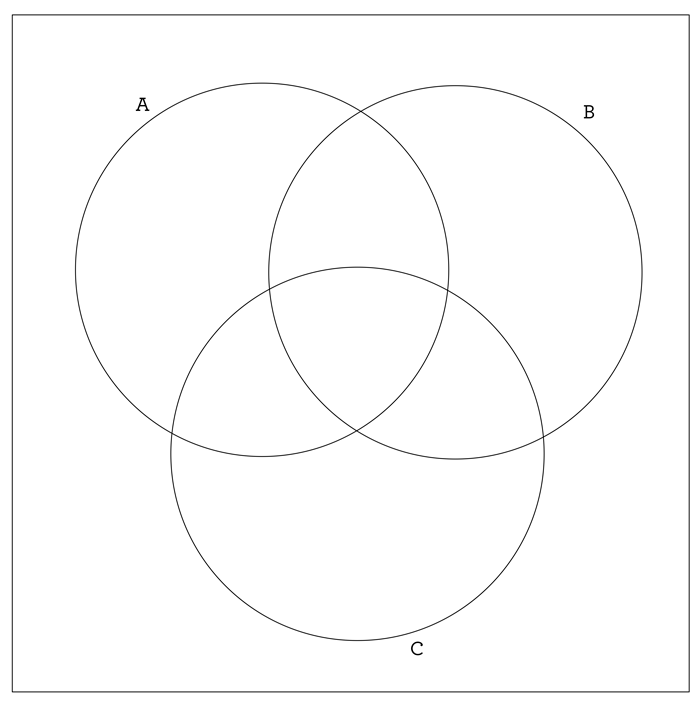
This picture represents every possible option for how things could actually be contained in the sets A, B, or C. For example, the middle region, inside A, B, and also C, would have things that are common to all the sets. There’s also a region for stuff that’s only in A (and so not in B or C), there’s a region for stuff that’s not in any of those three sets, etc. Let’s label each region to make sure that all possibilities really are represented in our picture.
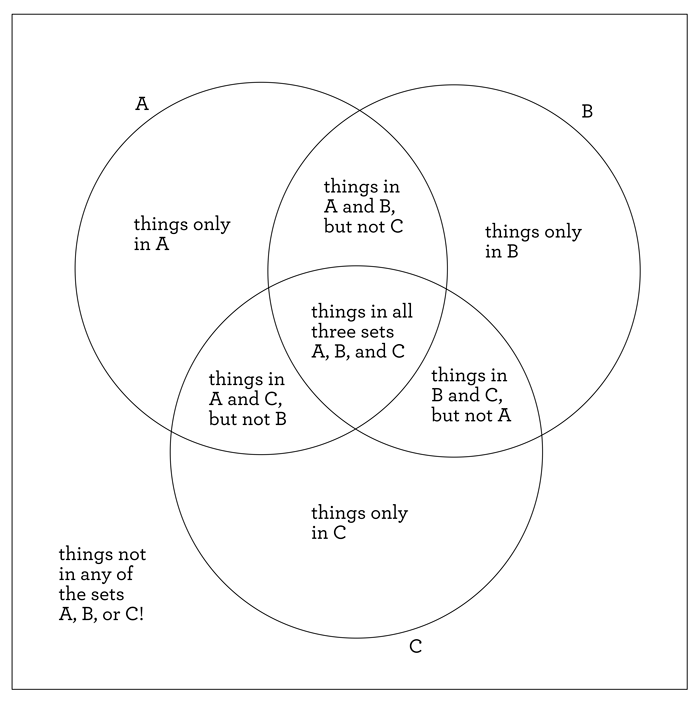
Yup, that’s everything! When you are dealing with three sets, there are 8 possible ways for things to be in those sets in some combination, and these 8 options are all shown above.
Can we see all the possibilities for four sets?
Strangely enough, textbooks don’t ask you to draw a Venn diagram that represents 4 sets, to show all the possible ways that those sets can contain things. Why is this? Well, first notice there’s a pattern here: for 2 sets, we need a Venn diagram with 4 = 22 regions; for 3 sets, we need 8 = 23 regions. For 4 sets, we would need a Venn diagram with 24 = 16 different regions (do you see why this pattern holds?). So, question: is it possible to draw a Venn diagram, with circles of course, that gives you 16 regions, representing every possible way that something can be inside some combination of our 4 sets? Try it. Here’s our attempt, where we tried to use a little common sense: we just added another circle to our 3-circle Venn diagram!
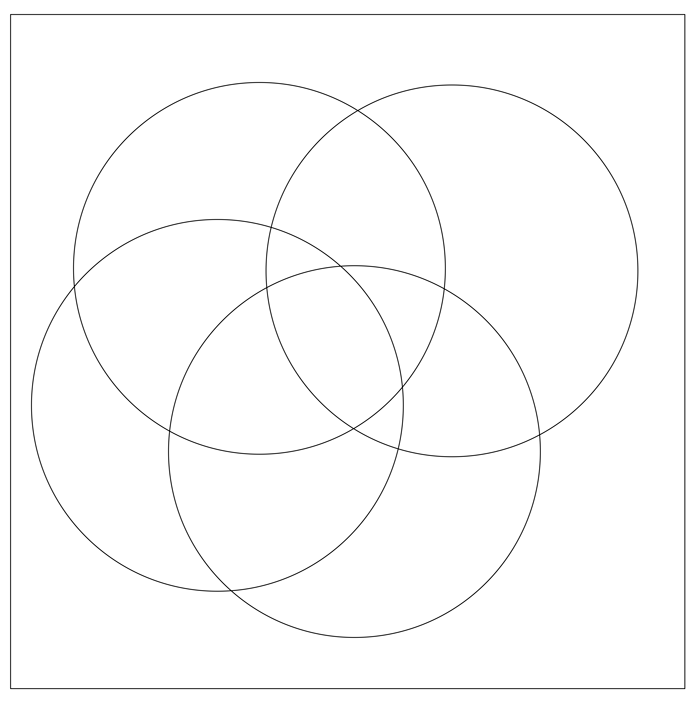
We wanted 16 regions, but there are only 14 regions here! That’s not enough regions; in fact, we are missing two overlaps… do you see which two? You can see in the diagram that there is no region for the stuff that would only be contained in the leftmost and rightmost circles, and not the other two. The other region we’re missing is the one for stuff that would only be contained in the upper left and bottommost circles.
So we missed the mark on our first attempt, but maybe we should keep trying? I think we’ll stop right there, because we happen to know an interesting and lovely fact: it isn’t possible to make a Venn diagram using circles that includes all of the necessary 16 regions! So weird! This is something that needs to be carefully proven, and this blog is already a tad long, so we will leave that for another time.
Sure, but we need shapes besides circles!
But wait! If we can’t make our 4-set Venn diagram with circles, maybe we can try other shapes? Could we use ellipses? triangles? shapes of different sizes? What if we were just dying to once again add something extra into our 3-circle Venn diagram, but by adding a really CRAZY shape, like a blob of some kind? Then could we get all of our prized 16 regions? We managed to do it. Try it yourself now!
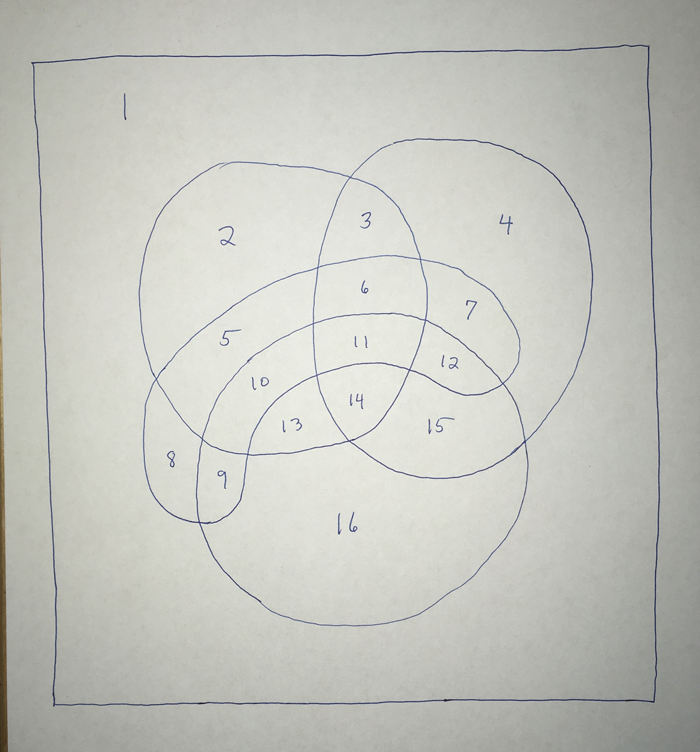
There are 16 regions there, so looking good! But we need to be sure that these 16 regions really do cover all the different possibilities we’re looking for. For instance, regions 2, 4, 8, and 16 are regions for things that are in exactly one of these sets. How can we be sure that all possible overlaps are really in that picture? Easy enough: label our sets A, B, C, and D (where D is our new blob set). Then, for each region in the diagram, we see which sets that region is inside of, and place those letters in that region.
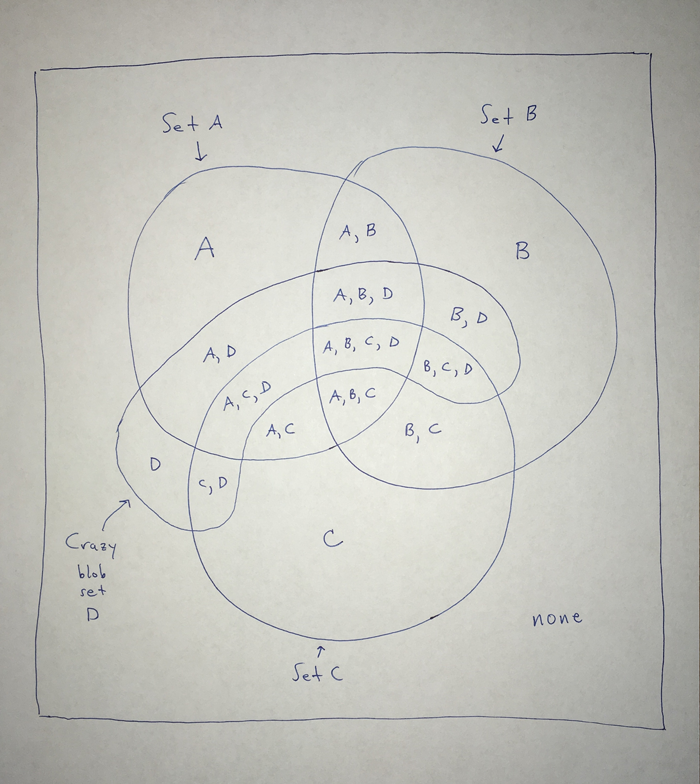
You can check for yourself that all the expected overlaps are there: there’s a region for things that are only in sets C and D and no others, a region for things that are in all the sets, etc. So, if you’d like to visualize 4 sets in the most general way possible, showing all the possible overlaps you could get with our 4 boxes, you cannot use circles, but you can absolutely use other, funkier shapes! What other shapes can you use? What about the situation for 5 sets? How many regions would you need? Have fun exploring!
Find this post interesting? Follow the blog using the link at the top of the page to get notified when new posts appear!
Want awesome tips and a mini-challenge, all designed to help you build vital problem-solving and critical thinking skills in your child? Click here to sign up for our monthly newsletter!
Looking for more interesting challenges to work through with kids? Head over to our Teachers Pay Teachers store and try Beans(which is, and isn't, connected to all this discussion of sets!).